Kaluza Analysis Software
The Kaluza Difference
Kaluza Analysis Software is stand-alone flow cytometry analysis software, designed to work with *.fcs and *.lmd files derived from flow cytometers. This software includes advanced features including processing multi-color files of up to 20 million events in real-time, while offering analytical speed that is dramatically faster than other commercially-available software.
Researchers in the areas of regulatory T cells, NK cell sub-populations, and mesenchymal stem cells are focused on the analysis of the differentiation stage and on the function of very small sub-populations of cells. Data files of several million events or more are required for statistically significant results. Kaluza Analysis enables researchers in these areas to run their high-content flow cytometry files at very fast speed, while maintaining an intuitive, user-friendly interface.
Analysis
To customize your Protocol, Kaluza Analysis provides a diverse offering of plot and table types, each of which can be customized for optimal data presentation.| Plot Types | Gates | Statistics | Compensation |
| • Histograms • Dot Plots • Tree Plots • Radar Plots • Density Plots • Contour Plots • Overlay Plots • Comparison Plots • Cell Cycle Analysis Plots • Add All Plots |
• Linear and Divider Gates • Quadrant / Staggered Quadrant Gates • Hinged Quadrant Gates • Polygon Gates • Rectangle Gates • Ellipse Gates • Boolean Gates • Auto Gates • Showing Gated Populations as Rare Events • Viewing Gate Logic |
• Number • % Total • % Gated • % Grandparent • Median • Arithmetic Mean • Mode • Standard Deviation (SD) • Coefficient of Variation (CV) • Half Peak of Coefficient of Variation (HPCV) |
• Adjusting Compensation • Saving a Compensation File • Importing a Compensation File • Resetting Spillover and Autofluorescence Vector Values • Accounting for Autofluorescence |
Report Generation
See how one user has designed templates with advanced analytical tools to streamline analysis and report generation to address in a GLP (Good Laboratory Practice) fashion.
An Educational Webinar Video on the Flow Cytometry Data Analysis
Four Simple Control Panels
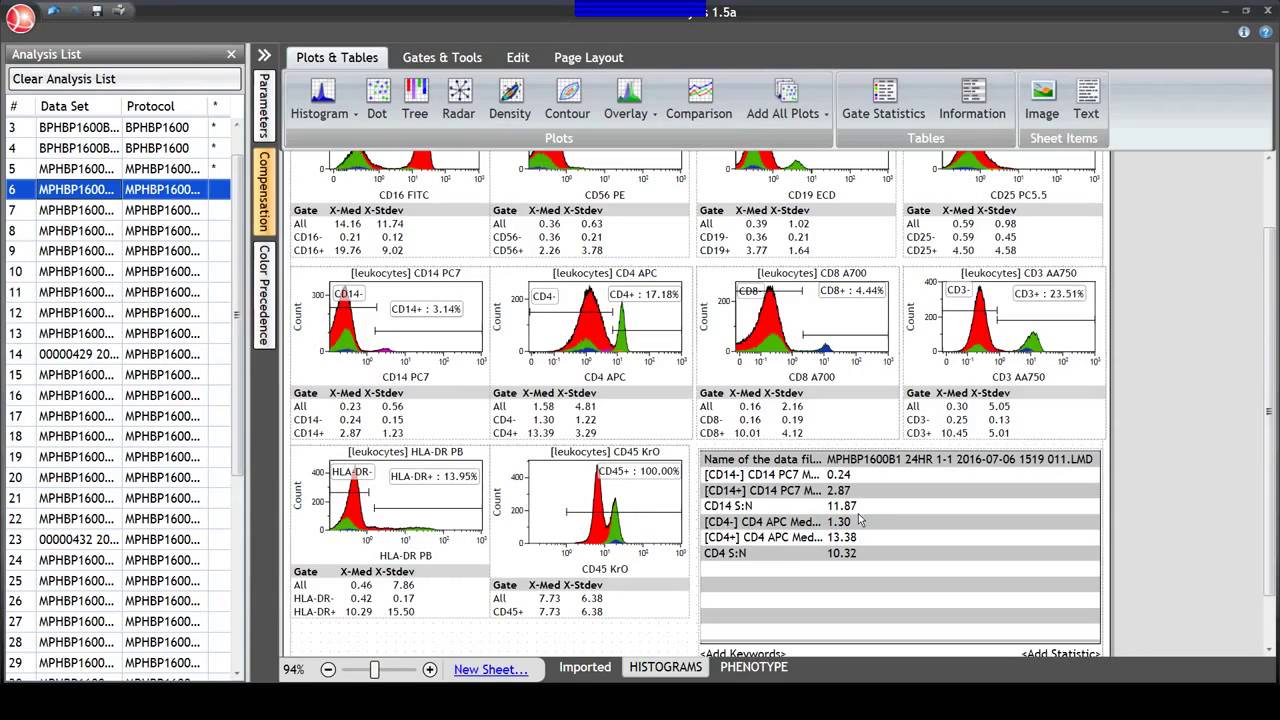
An efficient use of space keeps all functions accessible with few clicks. Work with multiple files, multiple plots and figures, multiple reports without the need to keep track of multiple windows. 1. Analysis List
Keep track of all of your files, including data files (fcs or lmd), protocols, composite files, or analysis files. Drag and drop to open, reorder, or apply data to protocols. Highlight shows active file and asterisk indicates unsaved work.
1. Analysis List
Keep track of all of your files, including data files (fcs or lmd), protocols, composite files, or analysis files. Drag and drop to open, reorder, or apply data to protocols. Highlight shows active file and asterisk indicates unsaved work. 2. Attributes Pane
Quickly access to view and edit parameter info, compensation, color precedence, and protocol options. Collapse the panes to maximize analysis space.
3. Workspace
Use the ribbon to create plots and tables, add gates, including auto gate, annotations, and adjust compensation. Add additional sheets or reports as you explore your data. Drag and drop plots and use the zoom tool to manage plots viewed in the workspace.
4. Tool Bar
Use the application button to access batch processing, QC report, plugin management, as well as open, save and export. The quick toolbar includes the unlimited undo and redo controls. And the info and help access detailed information including the complete instructions for use.
Just Right Click
At the heart of the Kaluza philosophy is the concept that what you need is just a right click away. Context specific radial menus put the tools you need where and when you need them.


