Comparing Data Quality & Optical Resolution of the Next Generation Optima AUC to the Proven ProteomeLab on a Model Protein System
Content Type: Application Note
Author: Julia P Luciano-Chadee | Beckman Coulter, Inc., Indianapolis, IN 46268
Chad Schwartz Ph.D. | Beckman Coulter, Inc., Indianapolis, IN 46268
Abstract
AUC provides a matrix-free environment that allows the near-native state characterization of a wide range of molecules. Our recently launched Optima AUC is the only commercially available instrument equipped with a state of the art optical system. Here, the new Optima AUC was compared to the ProteomeLab and tested to demonstrate higher resolution, accuracy, better data fitting and precision at a higher signal to noise ratio. The new Optima AUC stretches the scope of solutions provided by AUC and provides the user with well-determined macromolecular sedimentation parameters. The methods outlined here highlight the advantages of the Beckman Coulter Optima AUC for characterizing protein in varying concentrations.
Introduction
Since its invention in the 1920s, analytical ultracentrifugation (AUC) has been a powerful tool in the study of macromolecules in solution leading to impactful scientific discoveries1. AUC provides a matrix-free environment that allows the near-native characterization of proteins1, extracellular vesicles2, nucleic acids3, colloids4, and nanoparticles5. The Beckman Coulter ProteomeLab XL-A/I AUC instruments are capable of measuring sample parameters by monitoring Raleigh interference and UV/Vis absorbance one at a time in a single experiment.
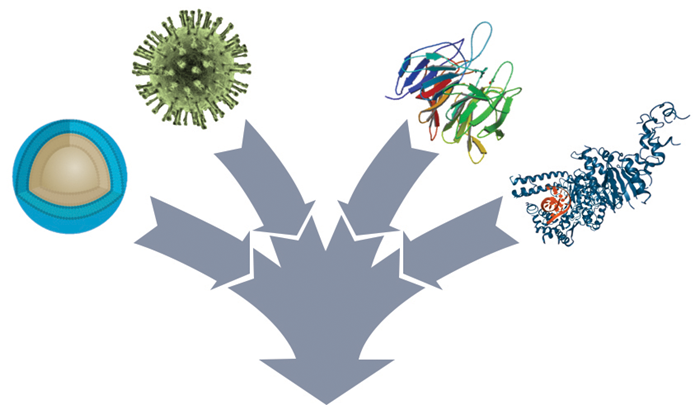
Our recently launched Optima AUC possesses an improved optical system (Table 1) that positions the field to advance in the development of new applications and the study of complex systems (Figure 1). Our new instrumentation makes the Optima AUC a powerful tool to study samples with high precision, resolution and accuracy.
| OPTICAL SYSTEMS | PROTEOMELAB XL-A/XL-I | OPTIMA AUC |
| FASTEST DATA ACQUISITION RATE | ABS: 90 sec/cell INT: 5 sec/scan |
ABS: <20 sec/cell INT: <5 sec/scan |
| MAX# OF WAVELENGTHS | 3 | 20 |
| WAVELENGTH PRECISION | +/- 3 nm | +/- 0.5 nm |
| LOWEST RADIAL RESOLUTION | 30 μm | 10 μm |
| ABSORBANCE FLASH LAMP FREQUENCY | 50 Hz | 300 Hz |
| CCD CAMERA SPECIFICATIONS | 2048 x 96 pixels | 2048 x 1088 pixels |
| INTERFERENCE FRINGES | ≥ _4 fringes/cell | ≥ _10 fringes/cell |
| USABLE CONCENTRATION RANGES | ABS: .005 - 1.5 mg/mL INT: .025 - 3-4 mg/mL |
ABS: .005 - ~1-2 mg/mL Luteinizing Hormone INT: .025 - ~4-5 mg/mL BSA** |
| Table 1: Comparison of specifications of Optima AUC and ProteomeLab | ||
 |
||
|
Materials
Bovine serum albumin (BSA, cat. A7906-10G)) was purchased from Sigma-Aldrich.
Optima AUC (P/N B86437, C00708), ProteomeLab XL I (P/N 969341, 969340), two sector sedimentation velocity analytical cells with quartz windows (P/N 392772), An 60 Ti rotor (P/N 361964), and torque stand (P/N 361318) were from Beckman Coulter, Inc.
Methods
BSA Sample Preparation
BSA stock solution was prepared by dissolving BSA powder into PBS to an absorbance of 1.0 OD at 280nm. The OD of the samples was measured using a Beckman-Coulter DU730 UV/Vis Spectophotometer with a 10mm pathlength. BSA was diluted to working concentrations of 0.4 and 0.9 OD in PBS.
Instrument Settings
The reference buffer matching the sample solvent was PBS buffer. The 2-sector analytical cells were maximally loaded with 440 μl in both reference and sample sectors. The cells were aligned in the An 60 Ti rotor, and equilibrated at 20˚C for greater than 1 hour. Samples were subsequently spun at 42,000 rpm, 20˚C, 6 hours scanning at Abs280nm in continuous mode. The method above was executed on the Beckman Optima AUC and the Beckman ProteomeLab XL-1 AUC instruments using the same samples assembled in the same analytical cells shaken between runs.
Data Analysis†
Data was extracted from the AUC controller and imported into SEDFIT 14.7 g7 (www.analyticalultracentrifugation.com). The data was analyzed using the fitting parameters shown in Figure 2. The data was extracted into GUSSI (http://biophysics.swmed.edu/MBR/software.html) and plotted for c(s) with an s value minimum constraint at 0.5S.
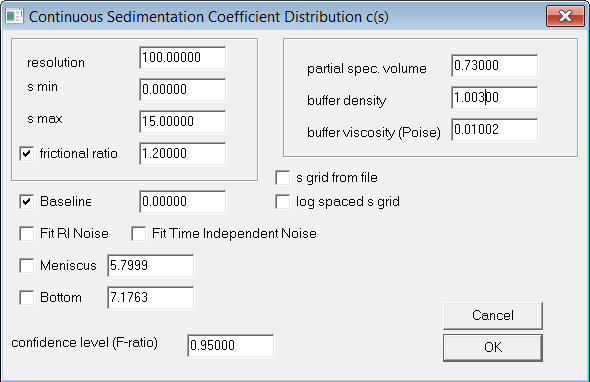 |
| Figure 2: SEDFIT fitting parameters |
Results & Discussion
Significant progress has been made on data analysis by deploying new and improved software. Current data analysis packages have now maximized the limit of the current optical systems and a hardware update is required to advance the tools of the scientific community6. Therefore, the new Optima AUC optical specifications is poised to circumvent data acquisition limitations, and lead the field to great AUC innovations.
To explore the optical advances of the new Beckman Optima AUC over the Beckman ProteomeLab XL-1, the same BSA data sets were acquired on both instruments and analyzed for sedimentation coefficient. Samples were run under identical conditions, and the data analysis was performed using the software SEDFIT.
|
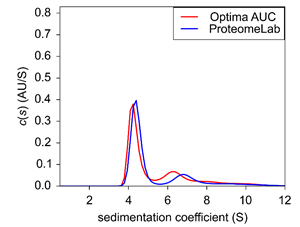
| Figure 3: Sedimentation velocity c(s) of BSA at 0.4 OD. |
At low concentration, the monomeric and dimeric BSA had a s20,w of 4.29-4.41 and 6.25-6.89, respectively, between the two instruments, but only the data acquired on the new Optima AUC clearly shows the additional trimer species emerging at 8.18 (Fig.3). In addition, as observed in the blue trace of figure 2, the data collected on the ProteomeLab exhibits a peak shift of the dimer, suggesting that this population is likely a smear of the dimer and trimer contribution at 6.89 c(s). No distinct third species is observed on the ProteomeLab. In contrast, the Optima AUC display all defined three populations. The comparison of the two data sets suggest that the improved optical system of the new Optima AUC is capable of distinguishing sparse populations within lowconcentration solutions.
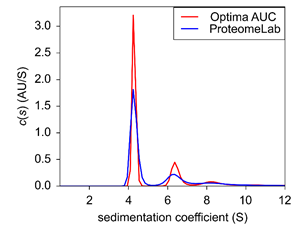 |
| Figure 4: Sedimentation velocity c(s) of BSA at 0.9 OD. |
At high BSA concentrations, data from both instruments showed all three oligomeric states of BSA (fig.4). However, the Optima AUC resolved the peaks at a higher signal-to-noise ratio that allowed for a better distinction of the different peaks (fig4. red trace). In part, the increased accuracy and precision of the Optima AUC is due to enhanced radial resolution and better meniscus fitting.
Figure 5 is a panel of the sedimentation velocity profiles and residual plots of every data set showing every scan. The new instrument is 4-5 times faster than the ProteomeLab due to increased frequency of the absorbance flash lamp. The Optima aquired three times as many data points per scans when compared to the ProteomeLab. This is due to the increased radial resolution from 30 μm to 10 μm (Table 1). Most importantly, as illustrated by the residual plot range, the Optima AUC performed better, producing less variation of the maximal residual and a tighter data fit.
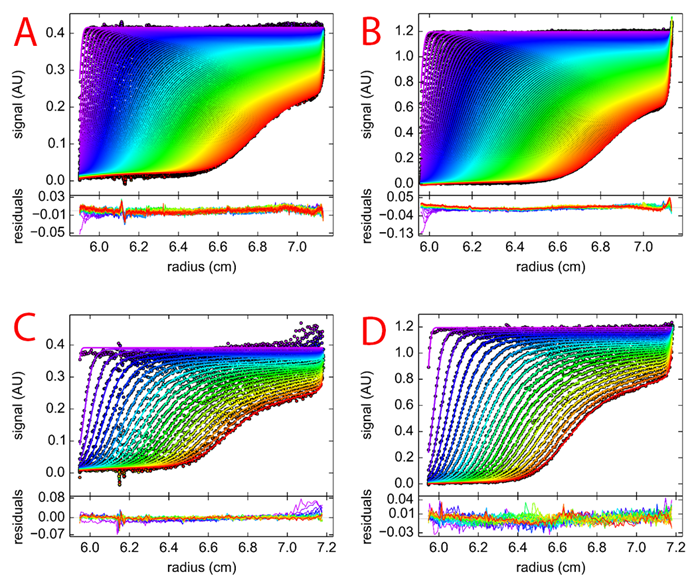 |
| Figure 5: Residual plots of (A) 0.4 OD in Optima AUC (B) 0.9 OD in Optima AUC (C) 0.4 OD in ProteomeLab (D) 0.9 OD in ProteomeLab. |
Finally, the precision and accuracy the new Optima AUC also enables tighter meniscus fitting. While analyzing the data in SEDFIT, and other data analysis programs, the meniscus position is set as a fitting parameter. The increased radial resolution of the experimental scans facilitate the visual inspection and definition of the true meniscal position, as it is demonstrated in Figure 6. Plot A shows the meniscus for the low concentration run on the Optima AUC and plot B shows the same cell run on the ProteomeLab. On the Optima AUC the meniscus position varies within a 50 μm precision, whereas the ProteomeLab spreads the meniscus over a 250 μm range. The true meniscus definition is improved by 5 folds. Better meniscus fitting lead to significant improvements in data fitting8 and the refinement of this parameter is a direct effect of the improved radial resolution. The decrease in optical imaging artifacts leads to well-determined macro molecular sedimentation parameters.
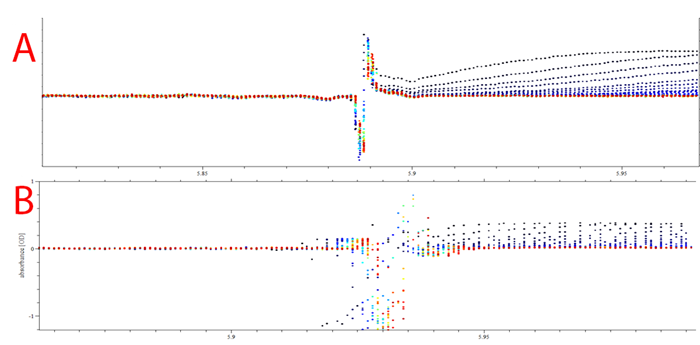 |
| Figure 6: SEDFIT plot of overlay meniscus position of 0.4 OD cell in (A) Optima AUC and (B) ProteomeLab. |
Conclusions
AUC is a first principle technique. Fundamentally, it is a powerful tool hindered only by the development and improvement of its optical systems. Beckman Coulter delivered the first AUC sample characterization tool and it continues to lead the field with the launch of the Optima AUC. Here we discussed the advances of the new Optima AUC and showed an improved optical systems that enables data acquisition with higher precision, resolution and accuracy.
In addition to the advantages of the new optical system discussed above, the Optima AUC is the only commercially available instrument equipped with the fastest acquisition rate of 20 seconds per cell, a multi-wavelength detector of up to 20 wavelengths with great precision and minimal time, and a broader range of sample concentration.
† Results generated from the softwares listed in this section are not guaranteed. Please see specific software tools for individual disclaimers.
References
- Howlett, Geoffrey J., Allen P. Minton, and Germán Rivas. "Analytical ultracentrifugation for the study of protein association and assembly." Current opinion in chemical biology 10.5 (2006): 430-436.
- Shulman S. The determination of sedimentation constants with the oil-turbine and spinco ultracentrifuges. Arch Biochem Biophys. 1953; 44: 230–240.
- Falabella, James B., et al. "Characterization of gold nanoparticles modified with single-stranded DNA using analytical ultracentrifugation and dynamic light scattering." Langmuir 26.15 (2010): 12740-12747.
- Diaz, Leosveys, Caroline Peyrot, and Kevin J. Wilkinson. "Characterization of polymeric nanomaterials using analytical ultracentrifugation." Environmental science & technology 49.12 (2015): 7302-7309.
- Plascencia-Villa, Germán, et al. "Analytical Characterization of Size-Dependent Properties of Larger Aqueous Gold Nanoclusters." The Journal of Physical Chemistry C 120.16 (2016): 8950-8958.
- Cölfen, Helmut et al. “The Open AUC Project.” European Biophysics Journal39.3 (2010): 347–359. PMC. Web. 5 Dec. 2016.
- Schuck P. Size distribution analysis of macromolecules by sedimentation velocity ultracentrifugation and Lamm equation modeling. Biophys. J. (2000) 78:1606–19.
- Zhao, Huaying et al. “Current Methods in Sedimentation Velocity and Sedimentation Equilibrium Analytical Ultracentrifugation.” Current protocols in protein science / editorial board, John E. Coligan ... [et al.] 0 20 (2013): 10.1002/0471140864.ps2012s71. PMC. Web. 2 Dec. 2016.
CENT-2176APP12.16
